The basic methodology used to read a paediatric ECG is the same as that used in an adult ECG, but the anatomical and physiological differences between children and adults mean that some features of the ECG that will be different. Furthermore, the progressive changes in the anatomy and physiology of children as they grow older means that there are also features that will vary according to the age of the child. Correct interpretation of the paediatric ECG can, therefore, be challenging.
Rate, rhythm and axis
The heart rate is much faster in neonates and infants and decreases as the child grows older. The rates are, generally speaking, as follows:
- Neonate: 110-150 bpm
- 2 years: 85-125 bpm
- 4 years: 75-115 bpm
- 6 years+: 60-100 bpm
Normal sinus rhythm can be interrupted intermittently in children by several rhythms that can be potentially regarded as normal. Common variations in rhythm which may be normal in children include:
- Pronounced sinus arrhythmia
- Short sinus pauses <1.8 seconds
- First-degree atrioventricular block
- Mobitz type 1 second degree atrioventricular block
- Junctional rhythm
- Ventricular or supraventricular extrasystoles
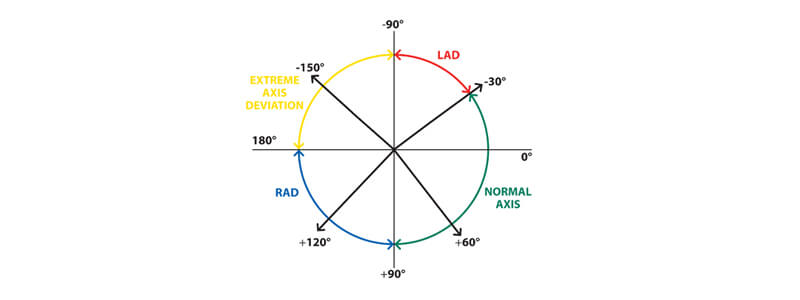
The normal QRS axis in children also varies with age. In utero, blood is shunted away from the pulmonary vasculature resulting in high pulmonary pressures. This causes the right ventricle to be thicker than the left ventricle at birth. This results in an ECG picture similar to that seen in the presence of right ventricular hypertrophy in adults (right axis deviation, dominant R wave in V1 and T-wave inversion in leads V1-V3). The QRS axis tends to vary with age as follows:
- At birth: +60 to +180 degrees
- At one year: +10 to +100 degrees
- At 10 years: -30 to +90 degrees
Waves
As with the rate, rhythm and axis, there are also important variations in the ECG waves that need to be considered when interpreting a paediatric ECG.
The P wave:
- There is no significant change in p wave amplitude during childhood
- P waves are normally upright in I and aVF
- P wave amplitude should be less than 3mm (if taller consider right atrial hypertrophy)
- P wave duration should be less than 0.09 seconds (if wider consider left atrial hypertrophy)
The Q wave:
- In most leads where a significant Q wave appears (II, III, aVF, V5, V6) there is a trend for the amplitude to double over the first few months of life
- Q wave amplitude usually peaks at around 3-5 months of age and then declines
- Normal Q wave duration should be 0.02-0.03 seconds
- Normal Q wave amplitude should be <5 mm (if higher consider hypertrophy or volume overload)
The R wave:
- The amplitude of R waves in the right praecordial leads decreases with age
- The amplitude of R waves in the left praecordial leads increases with age
- A dominant R wave in V1 and an RSR’ pattern in V1 can be normal
The T wave:
- The T wave pattern in childhood, particularly in the praecordial leads V1-V3, is very different from that of adults
- In the first 2-3 days of life, upright T waves in the right praecordial leads are normal
- It is usual for the T waves in these leads to invert during the first week of life
- Persistence of a positive T wave in the right precordial leads after the first can be suggestive of right ventricular hypertrophy or other abnormalities
- The T wave in V5 and V6 should be upright at all ages and inversion is suggestive of left ventricular hypertrophy
Segments
The ST segment in healthy children is isoelectric. There are, however, some ST segment changes that may be normal, including the following:
- ST depression or elevation of up to 1 mm in the limb leads
- ST depression or elevation of up to 2mm in the left praecordial leads
- Benign early repolarisation pattern in adolescents
- A downward slope of the ST followed by a biphasic inverted T wave
Intervals
Both the PR interval and QRS duration tend to be shorter in children than in adults due to smaller cardiac size and faster heart rates. These progressively lengthen throughout childhood and adolescence as the heart increases in size and the heart rate slows.
The PR interval tends to vary with age as follows:
- At birth: 80-110 ms
- In children: up to 150 ms
- In teenagers: up to 180 ms
It is often difficult to assess whether the Qt interval in children is normal or not because of the considerable variability of heart rate. Bazett’s formula (measured QT interval divided by the square root of the R-R interval) is the most commonly used method for determining the rate corrected QT interval (QTc). The QTc tends to vary with age as follows:
- Infants less than 6 months = < 0.49 seconds
- Older than 6 months = < 0.44 seconds
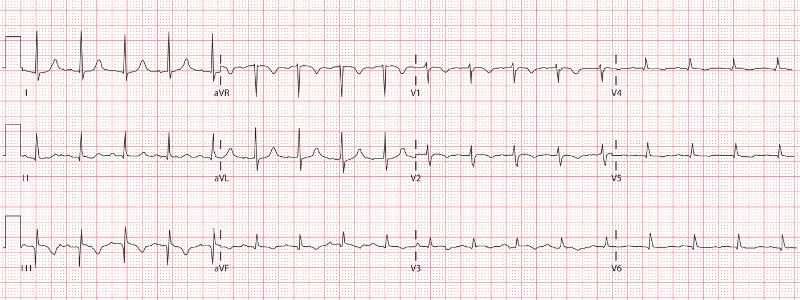
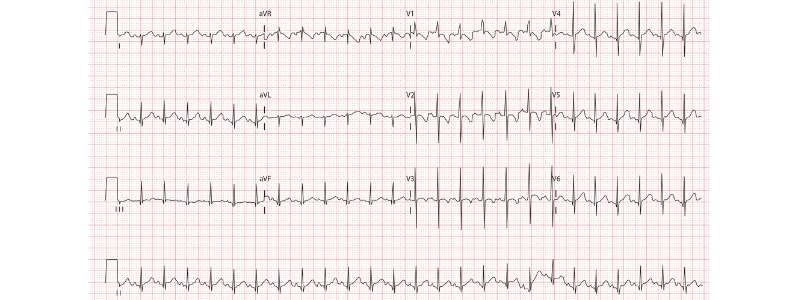
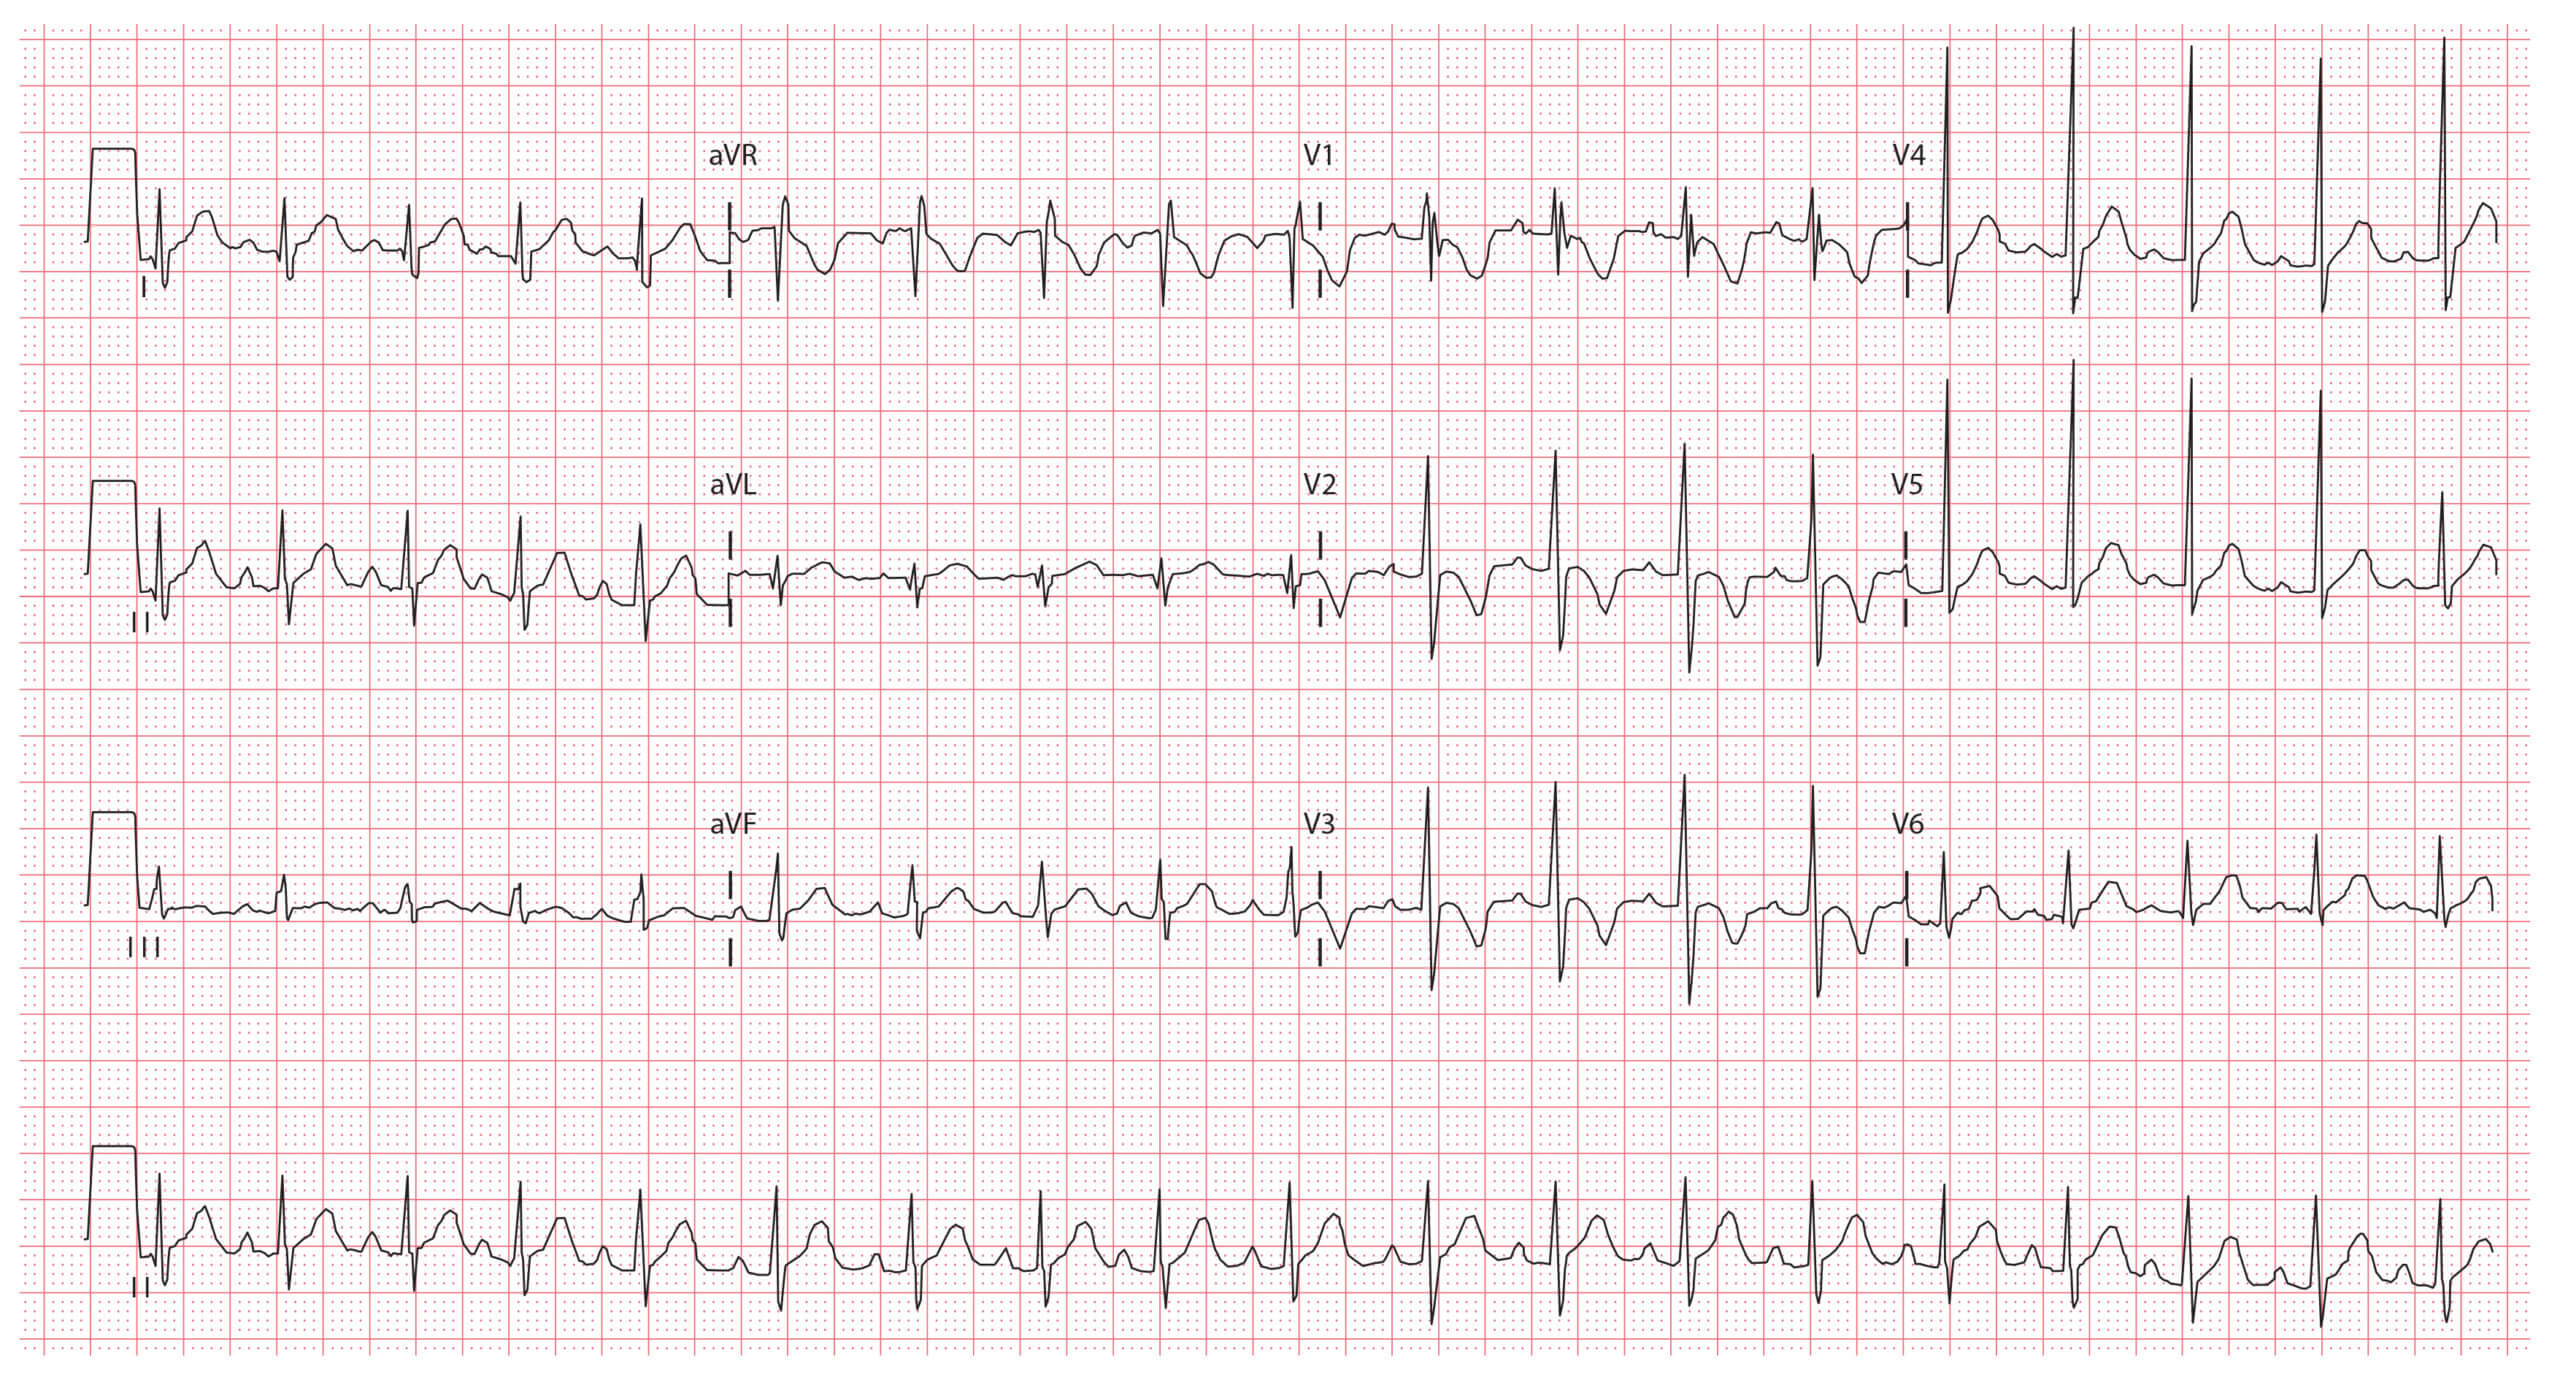
ECG example 1 (2-month-old infant):
Key features:
- Heart rate 150 bpm
- Right axis deviation
- T wave inversion in leads V1-V3
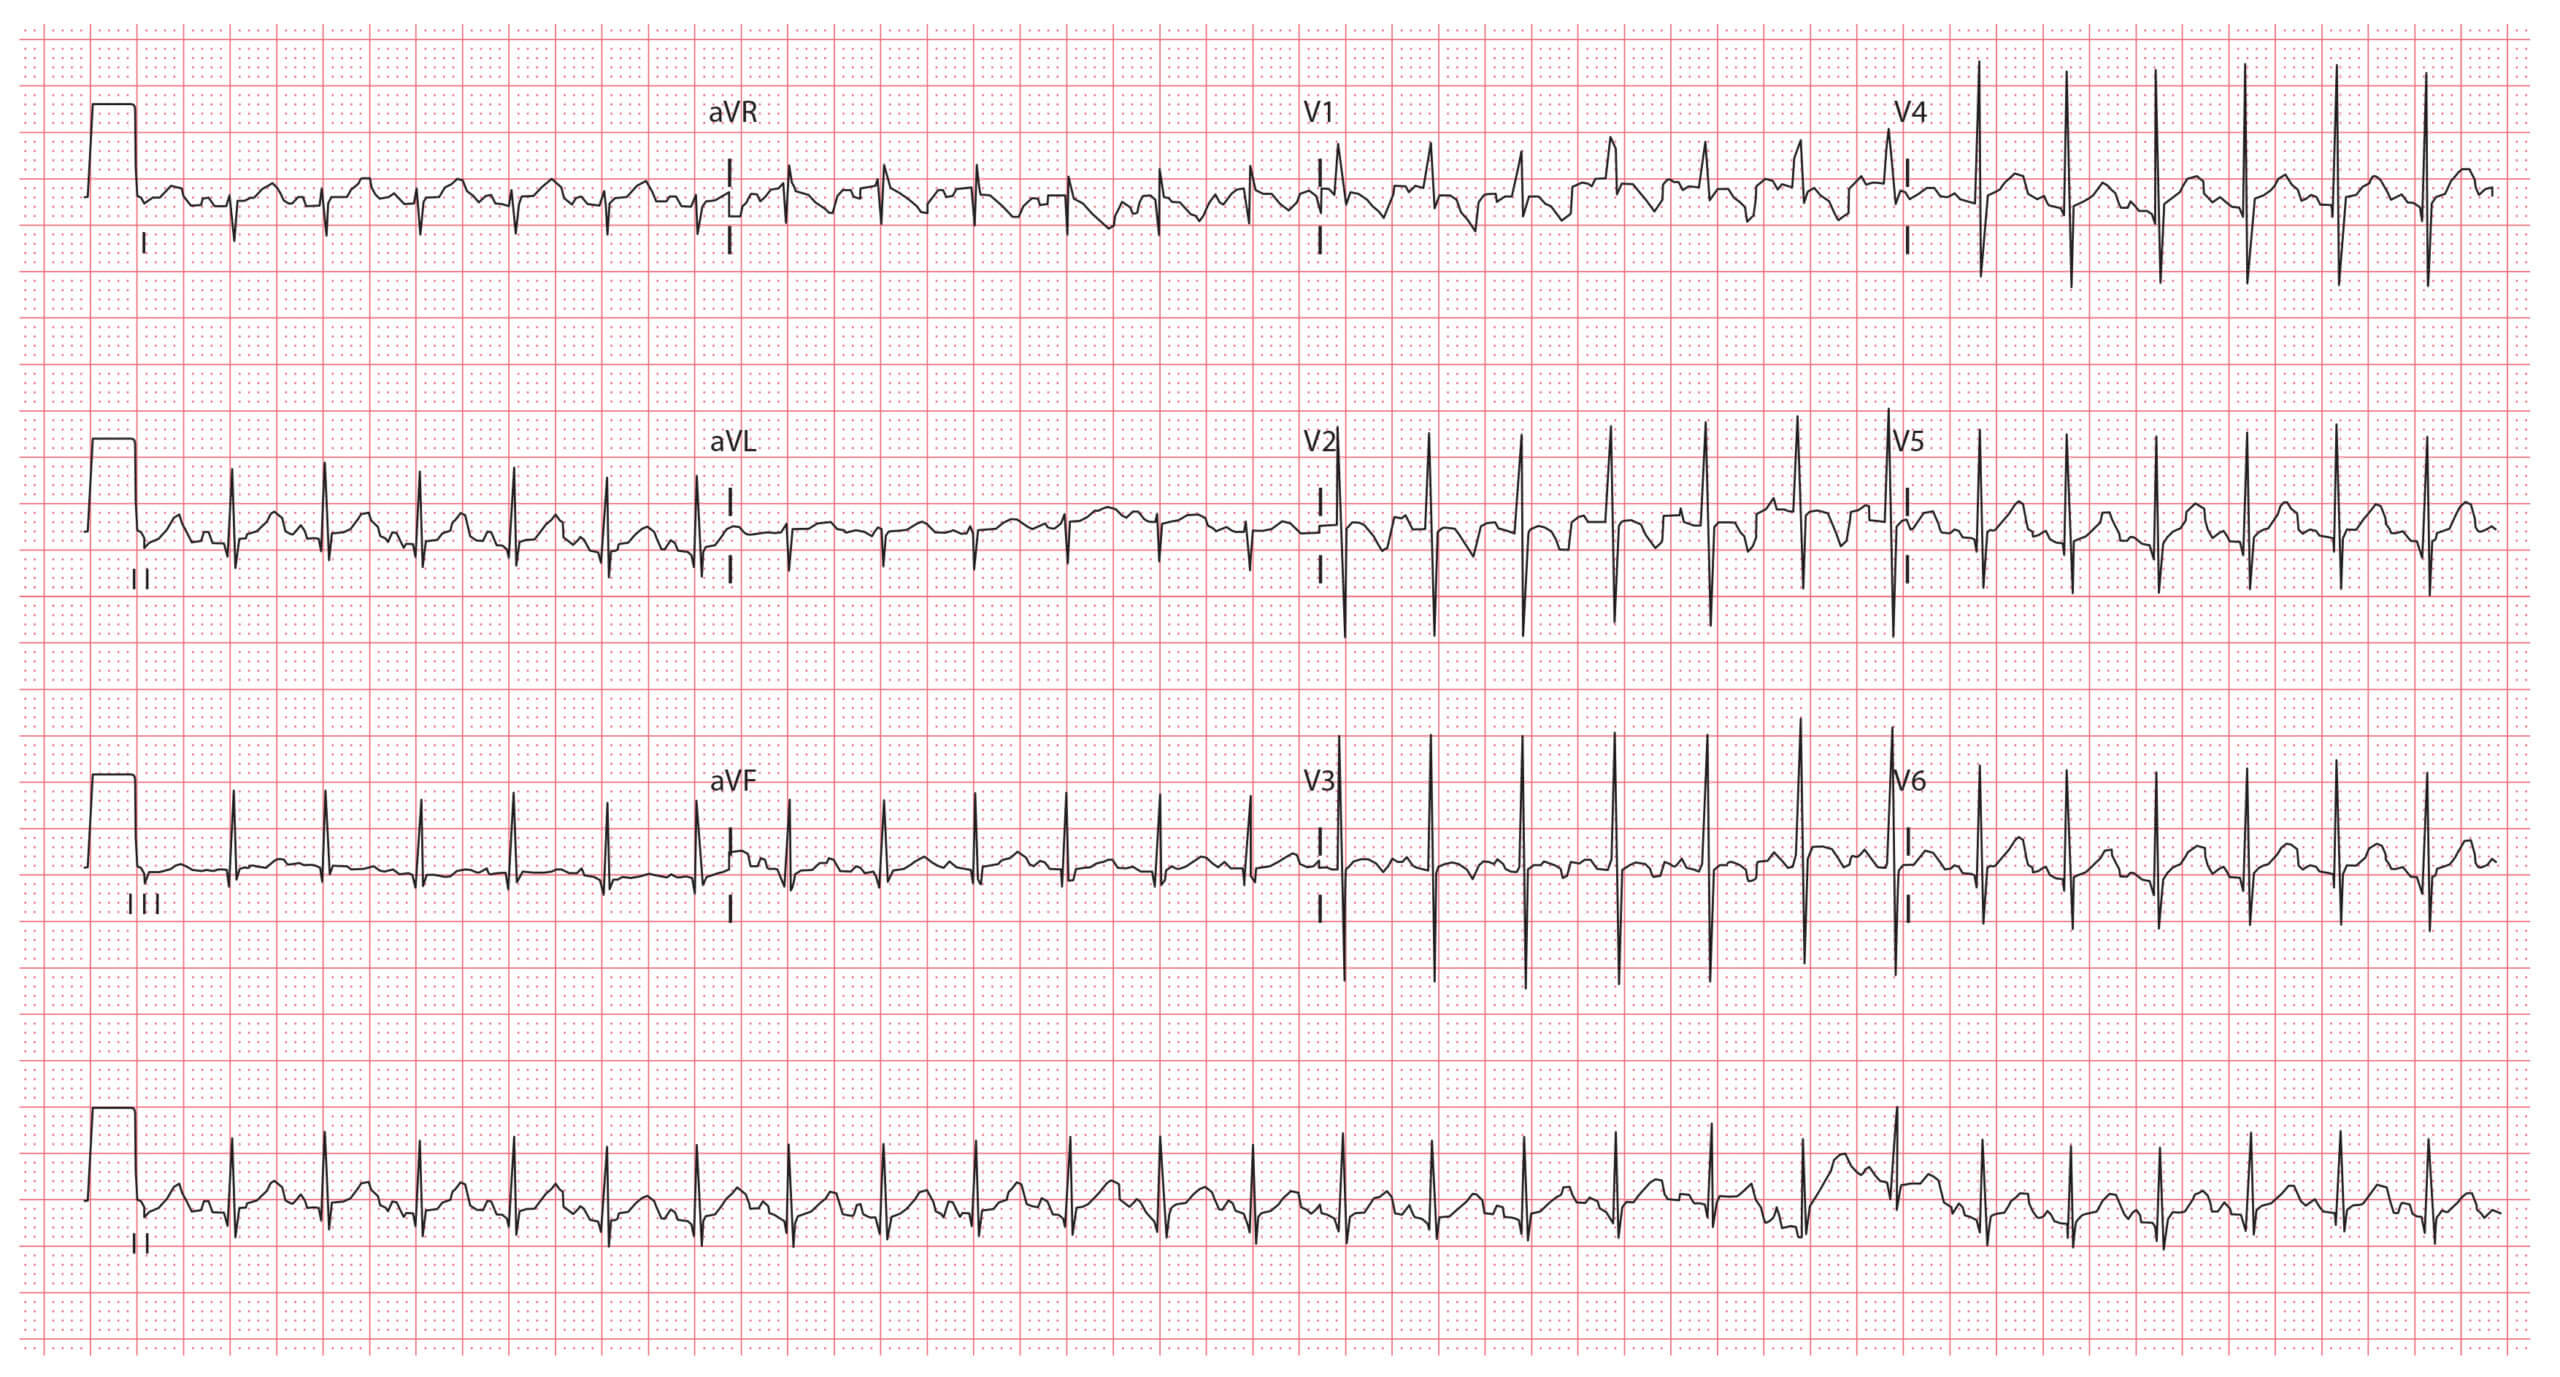
ECG example 2 (2-year-old child):
Key features:
- Heart rate 110 bpm
- T wave inversion in leads V1-V3
- Dominant R waves in V1-V3
- RSR’ pattern in V1
ECG example 3 (10-year-old child):
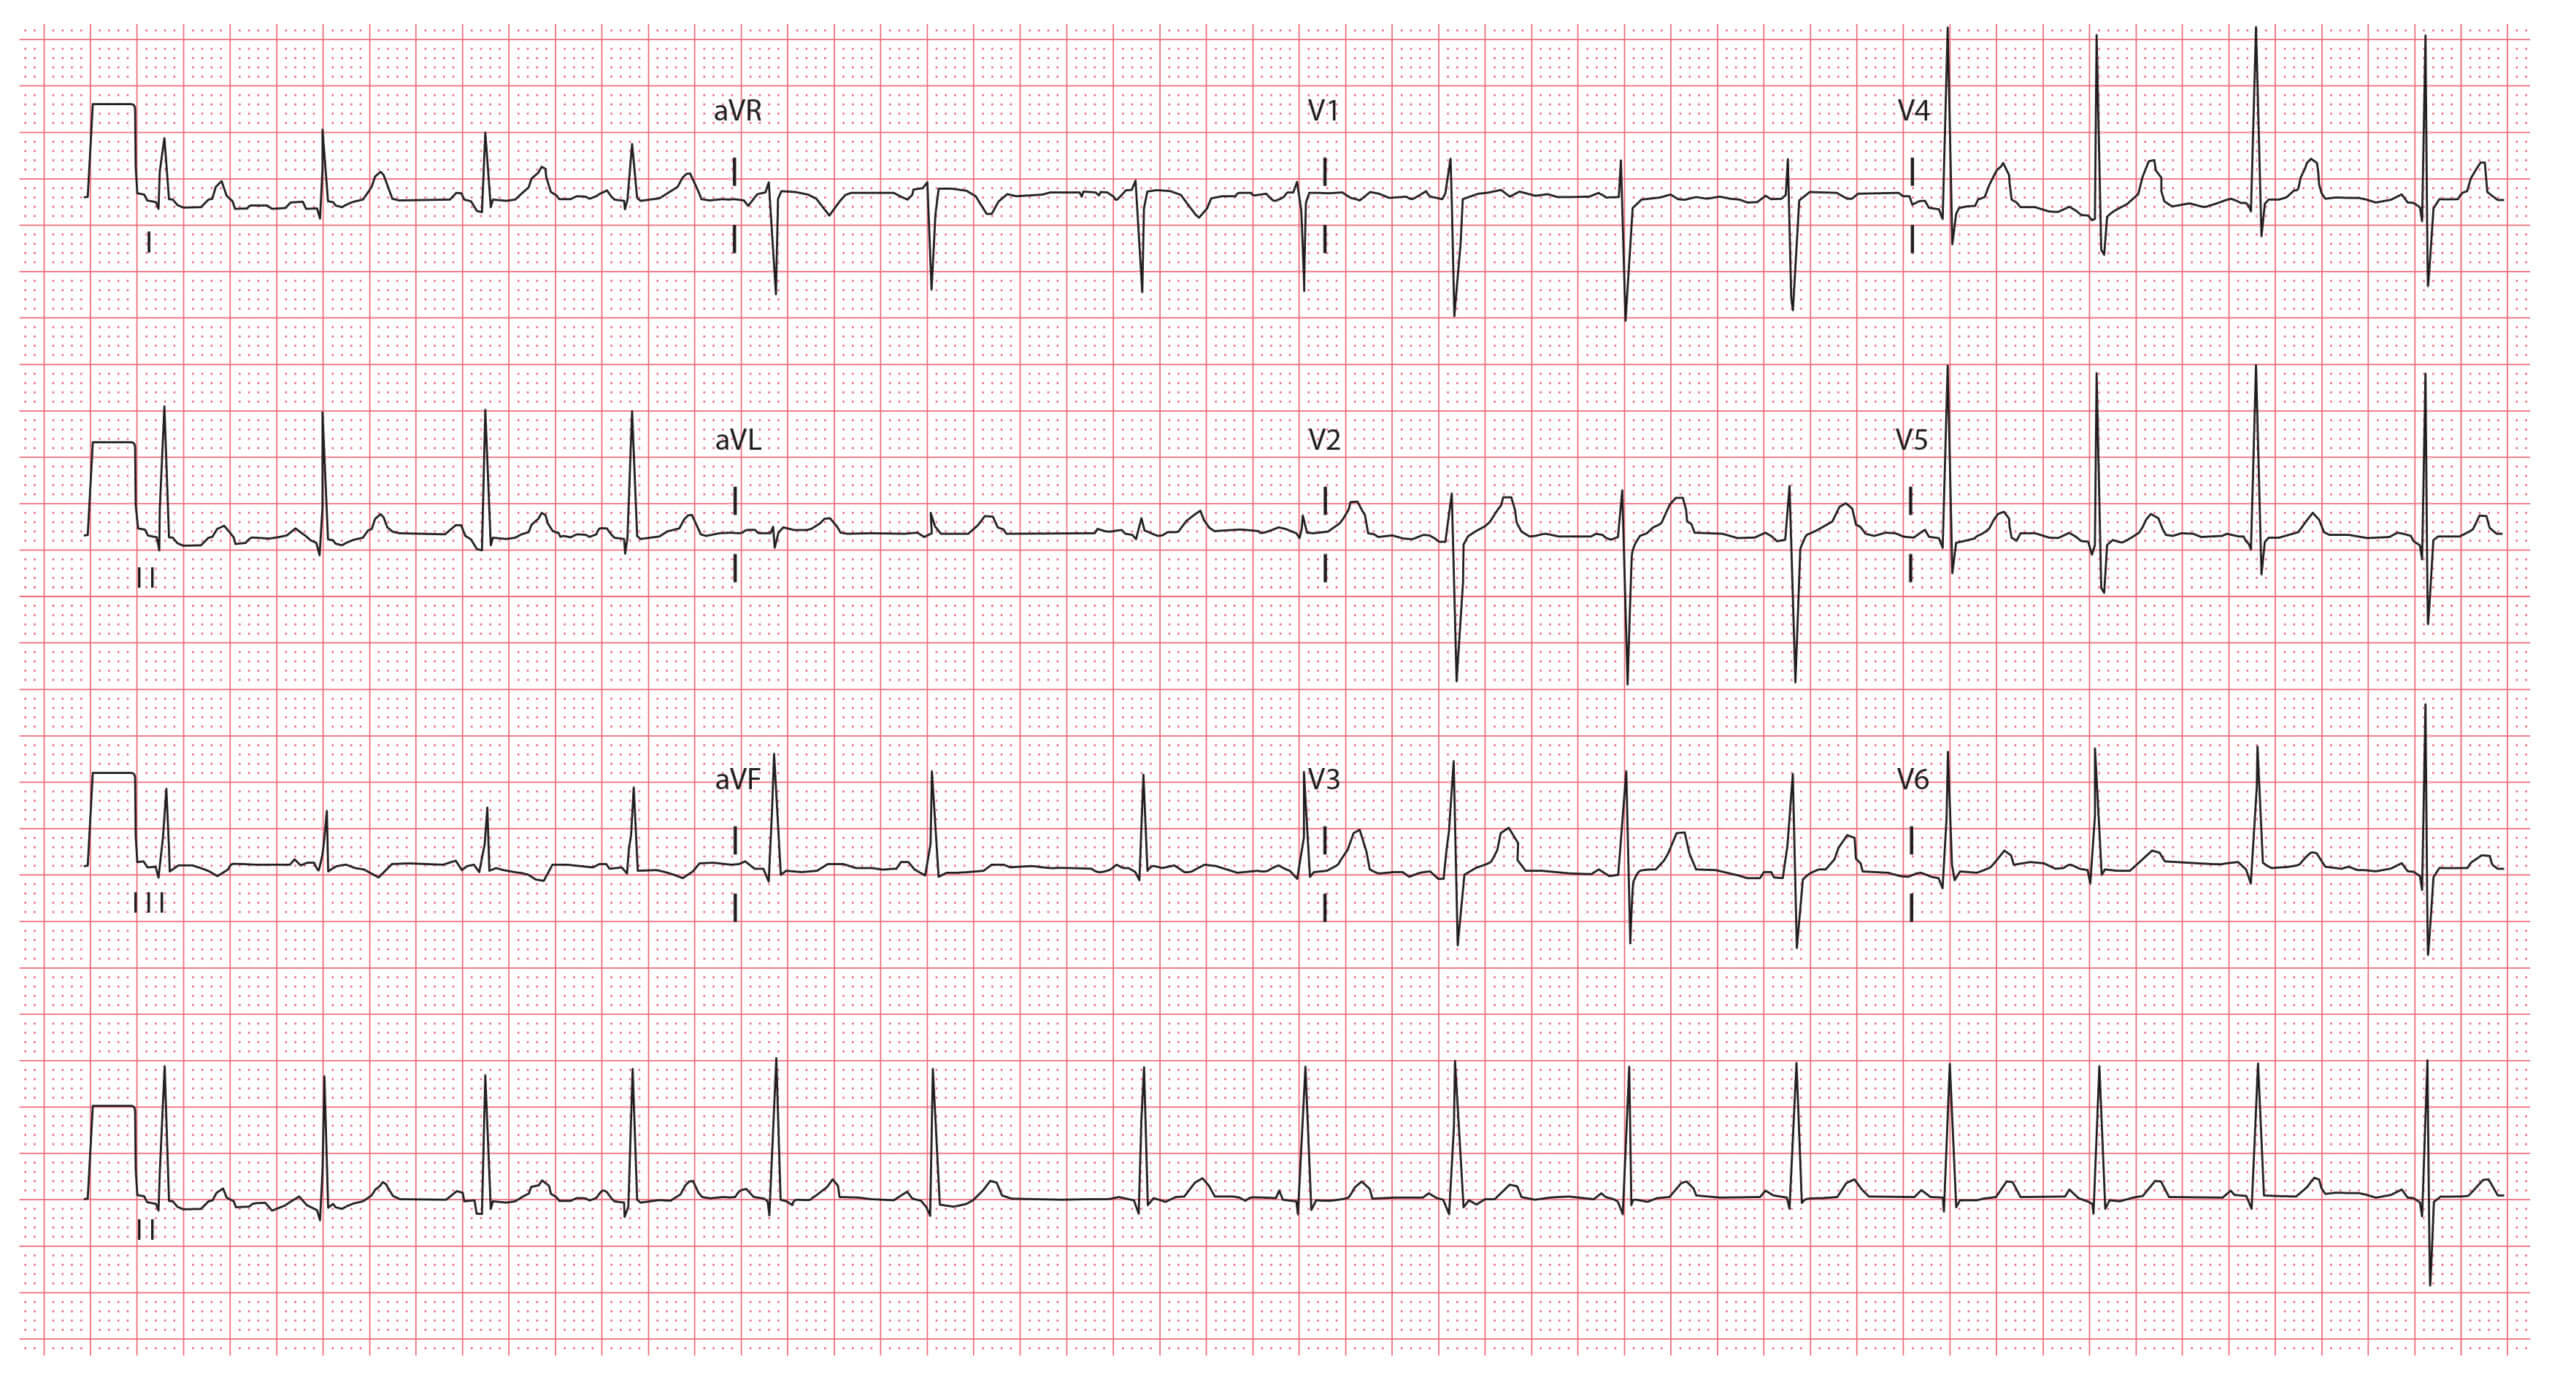
Key features:
- Heart rate 85 bpm
- Normal axis
- Sinus arrhythmia
ECG images © Medical Exam Prep